In practice, a Logical Framework:
- Gives a detailed description of the program showing how the program activities will lead to the immediate outputs, and how these will lead to the outcomes and goal (the terminology used varies by organization).
- Could be used to complete the sentence “we plan to do X which will give Y result”.
- Is normally shown as a matrix, called a log-frame. It can also be shown as a flow chart, which is sometimes called a logic model.
- Is linear, which means that all activities lead to outputs which lead to outcomes and the goal – there are no cyclical processes or feedback loops.
- Includes space for risks and assumptions, although these are usually only basic. Doesn’t include evidence for why you think one thing will lead to another.
- Is mainly used as a tool for monitoring.
How to write a logical framework (Log-frame)
Love them or hate them, logical frameworks (Log-frames) have become a staple of international development programs. Most donors will require one as part of your proposal, and it’s the first things an evaluator will ask for.
There is no agreed standard for log-frames. Some organizations call the goal an outcome, while others call it an objective or an impact.
The purpose of a log-frame
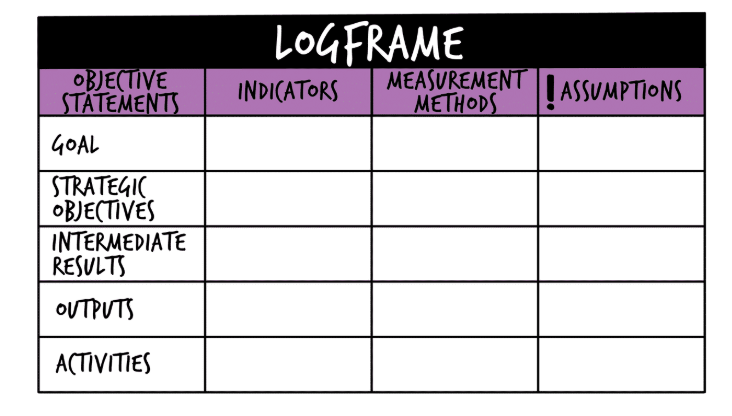
A log-frame is a table that lists your program activities, short term outputs, medium term outcomes, and long term goal. It is supposed to show the logic of how the activities will lead to the outputs, which in turn lead to the outcomes, and ultimately the goal.
Should I start with the goal or the activities?
Many people wonder whether they should start filling the log-frame from the top (starting with the goal), or from the bottom (starting with the activities).
Some people would say to start from the top (goal) and work down. That way you state what you hope to achieve, and then you work backwards to decide which outcomes, outputs and activities are required to achieve it.
However, this is often difficult to do in practice. Many organizations have a fixed set of activities that requires them to go from the bottom up. Other organizations may go back and forth between the goal and the activities trying to balance costs against results.
So just fill the table in whichever order makes the most sense to you. For each row of the table (activities, outputs, outcomes and goal) you will need to complete the following steps.
Describe the project summary
The first column in the table is the project summary. It describes each level of your project. For example, the goal of the project could be a “10% increase in the number of Grades 5-6 primary students continuing on to high school within 3 years.” The outcome leading to this could be “improve reading proficiency among children in Grades 5-6 by 20% within 3 years.”
When completing the project summary it is very important that the links between the different levels of the project are realistic and logical. Activities should logically lead to outputs, which should lead to realistic outcomes, and a sensible goal.
Choose indicators and means of verification
Once you’ve described each level of the project you need to choose indicators that will allow you to measure if it has been achieved. For example, if the goal is a “10% increase in the number of Grades 5-6 primary students continuing on to high school within 3 years” then the indicator is “percentage of Grades 5-6 primary students continuing on to high school.”
You can have more than one indicator for each level, but it’s a good idea to keep the total number of indicators manageable. For each indicator you need to describe how it will be measured – this is called the means of verification.
The indicators in your log-frame should match the indicators in your M&E framework.
Identify risks and assumptions
The final column in a log-frame is the risks and assumptions. This column lists things that must be true in order for one level to lead to the next level.
An easy way to check whether your risks/assumptions make sense is to look at the activities row and follow this logic: IF these activities are undertaken AND the assumptions are true THEN these outputs will be produced.
Then do the same with the outputs: IF the outputs are created AND the assumptions are true THEN the outcome will be achieved. And then the same for the outcome: IF the outcome is achieved AND the assumptions are true THEN the goal will be achieved.