Zahid Hussain No Comments

Maximizing Business Potential with Segmentation Analysis

Segmentation analysis is a crucial component of market research that involves dividing a target market into smaller, more manageable groups based on certain characteristics. This approach helps businesses understand the unique needs, behaviors, and motivations of each segment, allowing them to tailor their products, services, and marketing efforts to meet their specific needs.

The benefits of segmentation analysis are numerous and far-reaching, with the potential to greatly impact a business’s bottom line. For example, a study by the Nielsen Company found that segmentation analysis can increase marketing efficiency by as much as 85%. This is because companies can focus their resources on the most profitable segments, rather than wasting time and money on campaigns that may not resonate with their target audience.

Another benefit of segmentation analysis is that it enables companies to identify new opportunities in the market. By understanding the specific needs and preferences of each segment, businesses can develop new products or services that meet those needs, potentially leading to new sources of revenue.

In addition to these benefits, it can also help businesses improve customer satisfaction and loyalty. By understanding the unique needs and preferences of each segment, companies can provide a more personalized and relevant customer experience, leading to increased customer loyalty and advocacy.

Also Read: ROI Analysis of Marketing Campaigns

At Ace Research, we understand the importance of segmentation analysis and are dedicated to helping our clients maximize its benefits. Our team of market research experts has extensive experience in conducting in-depth segmentation analysis, and we use a variety of methods, including surveys, focus groups, and data analysis, to gain a comprehensive understanding of the market.

We then use this information to help our clients develop targeted marketing strategies and product development plans that meet the specific needs of each segment. Our approach is tailored to the specific needs of each client, and we work closely with them to ensure that their segmentation analysis is aligned with their overall business goals.

In conclusion, it is a valuable tool for businesses looking to increase marketing efficiency, identify new opportunities, and improve customer satisfaction and loyalty. By working with Ace Research, businesses can take advantage of our expertise and experience to ensure that their segmentation analysis is as comprehensive and effective as possible.

Zahid Hussain No Comments

ROI Analysis of Marketing Campaigns: Maximizing Benefits for Companies

Marketing campaigns play a crucial role in promoting products, services, and brand awareness. Companies invest heavily in these efforts to reach a wider audience and generate more sales, but it’s essential to determine if these investments are paying off. This is where ROI (Return on Investment) analysis comes in. ROI analysis measures the effectiveness of marketing campaigns by comparing the revenue generated to the cost of the campaign, providing valuable insights into the success of marketing efforts and helping companies make informed decisions.

Benefits of ROI Analysis for Companies

  1. Improved decision making: ROI analysis provides data-driven insights into the success of marketing campaigns, enabling companies to make informed decisions on how to allocate resources in the future. This information can help companies optimize their marketing efforts, ensuring that resources are being used effectively.
  2. Optimization of marketing efforts: By using ROI analysis, companies can identify areas for improvement in their marketing efforts and make them more cost-effective and efficient. This can lead to increased ROI in the long run.
  3. Increased accountability: ROI analysis helps companies hold marketing teams accountable for their efforts, ensuring that resources are being used effectively. This increased accountability can lead to improved marketing strategies and better allocation of resources.
  4. Better budget allocation: Companies can use ROI analysis to allocate marketing budgets more effectively, maximizing the returns on their investment. By understanding the effectiveness of different marketing channels, companies can allocate their budgets in a way that generates the highest returns.
  5. Increased ROI: By using ROI analysis, companies can identify successful marketing campaigns and replicate those efforts to generate even higher returns. This can help companies achieve their marketing goals and improve their bottom line.

Role of Market Research Companies like Ace Research

Market research companies like Ace Research can play a crucial role in helping companies benefit from ROI analysis. These companies have the expertise and resources to conduct in-depth research and analysis on marketing efforts, providing valuable insights into the success of marketing campaigns.

Ace Research can assist companies in the following ways:

  1. Campaign tracking: Ace Research can track marketing campaigns and gather data on their performance, providing a comprehensive picture of their ROI. This information can help companies make informed decisions on how to allocate resources in the future.
  2. Data analysis: Ace Research can analyze data and provide insights into the success of marketing campaigns, enabling companies to optimize their efforts. This can lead to improved marketing strategies and better allocation of resources.
  3. Recommendations: Ace Research can provide recommendations on how to improve marketing campaigns, maximizing the returns on investment. These recommendations can be based on data-driven insights and best practices in the industry, ensuring that companies are making the most of their marketing efforts.

Real-World Examples of ROI Analysis in Marketing Campaigns

Coca-Cola

Coca-Cola is one of the world’s largest beverage companies, and they understand the importance of effective marketing. The company uses ROI analysis to measure the effectiveness of its marketing campaigns, enabling them to allocate resources effectively and improve their marketing strategies. For example, Coca-Cola uses ROI analysis to determine the effectiveness of their sponsorship activities, such as sponsoring major sporting events. By using ROI analysis, the company can determine the return on their investment in these activities and make informed decisions on future sponsorships.

Procter & Gamble

Procter & Gamble is a multinational consumer goods company, and they use ROI analysis to measure the effectiveness of their marketing campaigns. The company uses ROI analysis to determine the return on investment for their advertising efforts, enabling them to allocate their advertising budget effectively and maximize the returns on their investment. For example, Procter & Gamble uses ROI analysis to determine the effectiveness of their digital advertising campaigns, including social media, search engine advertising, and display advertising. By using ROI analysis, the company can determine the return on their investment in these channels and make informed decisions on future digital advertising efforts.

Nike

Nike is a multinational corporation that designs, develops, and sells athletic footwear, apparel, and accessories. The company uses ROI analysis to measure the effectiveness of their marketing campaigns, including product launches and brand campaigns. Nike uses ROI analysis to determine the return on investment for these campaigns, enabling them to allocate resources effectively and maximize the returns on their investment.

ROI analysis is an essential tool for companies looking to maximize the returns on their marketing investment. By providing data-driven insights into the success of marketing campaigns, ROI analysis enables companies to make informed decisions on how to allocate resources, optimize their marketing efforts, and improve their bottom line. Market research companies like Ace Research can play a crucial role in helping companies benefit from ROI analysis, providing valuable insights into the success of marketing campaigns and helping companies make the most of their marketing efforts.

Zahid Hussain No Comments

Marketing Success: The Power of Consumer Behavior Analysis in Market Research

Marketing success is dependent on understanding consumer behavior. By comprehending the factors that drive customer purchases, businesses can create impactful marketing campaigns that resonate with their target audience. In this article, we explore the importance of consumer behavior research and its impact on marketing strategies.

Consumer behavior is a complex and multi-faceted phenomenon that greatly influences purchasing decisions. It encompasses an individual’s attitudes, beliefs, intentions, and decisions related to buying products or services. Understanding consumer behavior helps businesses to understand the factors that drive customer purchases, brand switching, and repeat business.

Consumer behavior analysis is a crucial aspect of market research that provides valuable insights into customer preferences, motivations, and purchasing habits. This information helps businesses to make informed decisions about product development, marketing, and sales strategies.

The benefits of consumer behavior analysis include:

  1. Improved Product Development: Understanding customer motivators leads to better products and increased sales and customer satisfaction.
  2. Better Targeting: Consumer behavior research provides deeper understanding of the target audience, including demographic information and buying triggers, to create more targeted marketing campaigns.
  3. Increased Customer Loyalty: Understanding customer loyalty drivers leads to marketing strategies that foster customer retention and repeat business.
  4. Improved Sales Strategies: Insights into the buying process inform effective sales strategies that drive sales.

Examples of successful marketing campaigns that leveraged consumer behavior research include Coca-Cola and Apple. Coca-Cola conducted research to understand customer motivators and positioned their drink as a refreshing treat. Apple is known for its innovative marketing campaigns informed by a deep understanding of consumer behavior.

At Ace Research, we understand the significance of consumer behavior research in successful marketing strategies. Our market research services provide businesses with the necessary insights to make informed decisions. Our knowledgeable team specializes in market surveys, focus groups, and data analysis. With a comprehensive understanding of the Pakistani consumer market, including primary cities, second-tier cities, and small towns, our services help elevate marketing strategies. Contact us today to learn more.

In conclusion, consumer behavior analysis is a crucial component of market research that provides the information needed for effective marketing and sales strategies. Regular analysis helps businesses stay ahead of the curve and remain competitive in an ever-changing market.

Zahid Hussain No Comments

HOW A CUSTOMER EXPERIENCE STRATEGY HELPS SCALE REVENUE GROWTH

Business professionals were surveyed by a research report and asked what the top business priority is for the next 5 years – and the answer came out on top. Can you guess what the top priority for a business is? M  If you guessed ‘customer experience’ (or CX), you guessed right.

It’s no surprise that customer experience is so high.

Research by American Express found that 86% of customers are willing to pay more for a better experience.

Companies that successfully implement a customer experience strategy achieve higher customer satisfaction rates, reduced customer churn, and increased revenues. Surprisingly, less than half of all organizations will be investing in the customer experience next year.

What is customer experience?

The customer experience (also known as CX) is defined by the interactions and experiences your customer has with your business throughout the entire customer journey, from first contact to becoming a happy and loyal customer.

CX is an integral part of Customer Relationship Management (CRM) and the reason why it’s important is that a customer who has a positive experience with a business is more likely to become a repeat and loyal customer.

In fact, a global CX study by Oracle found that 74% of senior executives believe that customer experience impacts the willingness of a customer to be a loyal advocate. If you want your customers to stay loyal, you have to invest in their experience! Happy customers remain loyal.

It makes sense, right?

The happier you are with a brand, the longer you stay with them. So, if you treat your customers poorly or ignore their customer service emails, then they are more likely to stop doing business with you. This is why companies that deliver a superior customer experience outperform their competitors – and this means they’ll be spending more with your business (and less in theirs!).

For example, here are a few statistics that caught our eye:

  • Customer experience is set to be the number one brand differentiator in recent years
  • 1 in 3 customers will leave a brand they love after just one bad experience,
  • Customers are willing to pay a price premium of up to 13% (and as high as 18%) for luxury and indulgence services, simply by receiving a great customer experience,
  • 49% of buyers have made impulse purchases after receiving a more personalized customer experience.
  • Customers who rate companies with a high customer experience score (i.e. 10/10) spend 140% more and remain loyal for up to 6 years.

So, it’s extremely important that you focus on the experience you deliver to your customers.

In most cases, a customer’s first point of contact with a company is usually by interacting with an employee (either by visiting a store or by speaking on the phone). This gives your business an opportunity to deliver great customer service. However, customer service is only one aspect of the entire customer experience. For example, if you book a vacation on the phone and the person you are speaking with is friendly and helpful, that’s good customer service. Yet, if your tickets arrive early and the hotel upgrades your room, then that’s a great customer experience!

Like most things in today’s marketplace, customer experience has changed – it’s more than person-to-person service, and thanks to technology, companies can connect with their customers in new and exciting ways.

For example, using CRM software, you can view customer purchase history and to predict future needs even before the customer knows they need it. Having the ability to predict a future need will let you be proactive and attentive and, it means you can do things like;

  • Provide related products based on purchase history
  • Create and deliver targeted email marketing campaigns
  • Understand the 360-degree view of the customer

Customer service is still as important as ever, but it’s no longer the sole focus of the customer experience. Now, the customer experience brings new ways to strengthen customer relationships through technological breakthroughs.

The challenge here is that even though it’s a high priority, most companies are failing to deliver a good customer experience.

Customer expectations are rising, faster than the speed that companies can improve their customer experience. Customers expect every interaction, end-to-end, to be the best experience they have with any company – not just yours!

Impact of bad customer experiences

If a great customer experience is focused on ensuring all interactions and touchpoints with your business is easy, enjoyable, and seamless, then the exact opposite is true when it comes to a bad customer experience.

More than $62 billion is lost each year to bad customer service. Meanwhile, another study found that 91% of unhappy customers leave a brand without complaining.  It doesn’t get any better. Only 10% of consumers say brands meet expectations for a good experience.

Some of the most common causes of bad customer experiences involve:

  • Difficult purchasing processes
  • Negative experiences with customer support
  • Compromising a customer’s personal security
  • Waiting too long on hold
  • Ignoring customer feedback

So, the question remains, how can your organization create a great customer experience strategy?

7 ways to improve the customer experience

Let’s take a look at seven ways to create a great customer experience strategy to help you improve customer satisfaction, reduce churn and increase revenues – including examples.

  1. Create a clear customer experience vision

The first step in your customer experience strategy is to have a clear customer-focused vision that you can communicate with your organization. The easiest way to define this vision is to create a set of statements that act as guiding principles.

Once these principles are in place, they will drive the behavior of your organization. Every member of your team should know these principles by heart and they should be embedded into all areas of training and development.

Often companies lack the required foresight and skills to develop a customer experience vision. In such a case, our company Ace Research with a hands-on experience profile can create a practical, target-oriented, and sustainable CX vision.

  1. Understand who your customers are

The next step in building upon these customer experience principles is to bring to life the different types of customers who deal with your customer support teams. If your organization is going to really understand customer needs and wants, then they need to be able to connect and empathize with the situations that your customers face.

Ace Research also possesses vast experience in customer profiling. With numerous projects successfully completed, our team of experts acquired sufficient knowledge to develop responsive and outcome-based profiles of existing and prospective customers.

  1. Create an emotional connection with your customers

You’ve heard the phrase “it’s not what you say; it’s how you say it”?

Well, the best customer experiences are achieved when a member of your team creates an emotional connection with a customer.

When a customer was late in returning a pair of shoes due to her mother passing away. When Zappos found out what happened, they took care of the return shipping and had a courier pick up the shoes without cost. But, Zappos didn’t stop there. The next day, the customer arrived home to a bouquet of flowers with a note from the Zappos Customer Success team who sent their condolences.

Research by the Journal of Consumer Research has found that more than 50% of an experience is based on an emotion as emotions shape the attitudes that drive decisions.

Customers become loyal because they are emotionally attached and they remember how they feel when they use a product or service. A business that optimizes for an emotional connection outperforms competitors by 85% in sales growth.

How you handle your customers and make them feel, at every step of their journey, has a huge impact on if and when they buy, how long they stay, if they go – and if they turn into raving fans.”

A positive experience for customers means a lot, as studies prove time and again:

  • 64% of consumers are more likely to recommend a brand to others if it offers simpler experiences and communications.
  • 71% of people recommend a product or service because they received a “great experience”.
  • 65% of all consumers find a positive experience with a brand to be more influential than great advertising
  1. Capture customer feedback in real-time

How can you tell if you are delivering a WOW customer experience?

You need to ask – And ideally, you do this by capturing feedback in real-time. Use live chat tools to have real-time conversations and when done, send a follow-up email to every customer using post-interaction surveys and similar customer experience tools.

  1. Use a quality framework for the development of your team

By following the steps above, you now know what customers think about the quality of your service compared to the customer experience principles you have defined. The next step is to identify the training needs for each individual member of your customer support team.

Many organizations assess the quality of phone and email communication, however, a quality framework takes this assessment one step further by scheduling and tracking your team’s development through coaching, eLearning, and group training.

  1. Act upon regular employee feedback

Most organizations have an annual survey process where they capture the overall feedback of your team; how engaged they are and the business’s ability to deliver an exceptional service.

  1. Measure the ROI from delivering a great customer experience

And finally, how do you know if all this investment in your teams, process, and technology are working and paying off?

The answer is in the business results. Measuring customer experience is one of the biggest challenges faced by organizations, which is why many companies use the “Net Promoter Score” or NPS, which collects valuable information by asking a single straightforward question:

“How likely are you to recommend us?”

NPS, which was created by Rob Markey and Fred Reichheld at Bain and Company, is a highly suitable benchmark for a customer experience metric because a lot of companies use it as the standard customer experience measurement.

And the fact that it’s simple to implement and measure makes the NPS a favorite with company boards and executive committees.

We’ve used NPS at Ace Research for several years now.

  1. It shows our customers that we care. We use the feedback to open up a dialogue and build relationships with our customers.
  2. NPS helps us understand common issues among our customer base so we can quickly solve them.
  3. We invite customers who participate in NPS to collaborate with us on projects, such as webinars, our ambassador program and to act as referrals for new customers.

The real value in NPS lies in having conversations with customers.

Zahid Hussain No Comments

Your Business Must Sustain Inflation, But How?

Businesses lacking a way forward for economic downturns are the most affected in times of crisis. Adequate analysis of the business environment, based on authentic data, validates your plan of action and steers your business in achieving its objectives.

Inflation and Risk Reduction

Inflation occurs when an economy grows due to increased spending without an accompanying increase in the production of goods and services. When this happens, prices rise and the currency within the economy is worth less than it was before. The currency essentially won’t buy as much as it would before. Inflation is a decline in the purchasing power of money over time.

Impact of Inflation on Startups

Lacking proper mentorship, a practical approach toward conducting business, and foremost important, experience makes, the life of startups short-lived. An overwhelming initiative become the victim of internal and external failures. Such failures, if managed and planned can be overcome very easily but lack of business insight, hesitation and unawareness to conduct pre-requisite research and analysis make things difficult with time.

Companies tend to deal with inflation by raising prices, accepting smaller margins, or reducing product costs (and often quality). Managers can upset their customers by raising prices, upset their investors by cutting margins, or upset practically everyone by cutting corners in order to cut costs. If customers are more price-sensitive than quantity sensitive, they are less liable to notice a price increase in the form of a smaller quantity at a constant price. It’s likely that consumers’ willingness to spend on discretionary items will diminish while costs remain high.

When inflation rises, the purchasing power of consumers erodes – in simple terms, they can now buy fewer goods and services than they used to. This means businesses will record lower sales, reducing the total revenue of the business. The pandemic has hit sectors differently, and the general inflation data and trends may not apply to all industries. For instance, sectors still recovering from the pandemic impact, like airlines and hotels, have not seen price levels fully recover to their previous levels. For businesses, it is important to reevaluate the current industry positions and the existing business dynamics within the sector. Some sectors were severely impacted, and now industry players are left with fewer competitors, while others face supply chain disruptions and need to source new suppliers. But here the question arises, who will be redefining business priorities? How to gauge changing customer perspectives and above all what actions need to be taken for improving growth and returns. Well, although these questions require the length of deliberation and analysis; both micro and macro but for this to happen, authentic information required to make decision making is very crucial. Here comes the role of market research agency and we here at Ace Research strive to provide the best possible solution to your business needs. Our panel of expert business analysts has worked with a handful of organizations for retracting the loss-making units and redefining business goals for optimum results.

Ways to contain inflationary pressure with proactive strategies

The most fundamental way of protecting against inflationary risk is to build an inflation premium into the interest rate or required rate of return (RoR), which is demanded by an investment. More serious inflationary risk occurs when the actual rate of inflation turns out differently from what is anticipated. Rising inflation means that the interest payments have progressively less purchasing power, and the principal, when it is repaid after several years, will buy substantially less than it did when the investor first purchased the bond.

To mitigate the impact of uncertainty, contingencies play a very vital role. Ace Research not only assess the market needs but also, analyses from various perspectives the risks associate with doing any type of business. We work on different strategies to keep our clients informed about various types of risk associated with your business and also, way to minimize and eradicate its negative impact on your operations and returns; both in the short and long term.

Our Role

Ace Research System is a market research firm that helps startups and businesses, capitalize on understanding the importance of data collection, and the interpretation and analysis of that data. Research is an essential component as it helps us find out which action works best, it also plays an important role in discovering alternate roles and solutions for the inflation in the market and making sure that the already existing solutions are utilized to their best capacity. Conducting research develops a better understanding and enhances decision-making capabilities in the firms. Research helps you understand what you are up against and then, it builds a foundation for your company to help you make better decisions.

We offer numerous models of analysis, based on business requirements such as;  pre/post product evaluation surveys, activation evaluation, and pre-launching surveys to check that the product being launched in the market does have any opportunity to survive in the market and if it is being demanded by the customers or not. With the help of this, you will make an informed decision along with a calculated risk. It helps you in understanding that your product has enough potential that if, one day you raise your prices a little and increase your profit margins, you will still be able to survive in that condition. But if you are unaware of the potential your product holds, or the features you can add to make your product better, then you are taking the risk of losing your potential customers. Ace Research help brands identify their substitute products and competitors so that you have ample of information next time they plan a move.

Zahid Hussain No Comments

Why Ethnographic Research?

Ethnography is the branch of anthropology that involves trying to understand how people live their lives. Unlike traditional market researchers, who ask specific, highly practical questions, anthropological researchers visit consumers in their homes or offices to observe and listen in a non-directed way. Our goal is to see people’s behavior on their terms, not ours. While this observational method may appear inefficient, it enlightens us about the context in which customers would use a new product and the meaning that product might hold in their lives.

The aim of ethnographic research
Ethnographic research is a qualitative study looking at the social interaction of users in a given environment. This research provides an in-depth insight into the user’s views and actions along with the sights and sounds they encounter during their day. It provides the researcher with an understanding of how those users see the world and how they interact with everything around them.
Ethnographic research include direct observation, diary studies, video recordings, photography and artefact analysis such as devices, which a person uses throughout the day.
• Observations can be made anywhere from the user’s workplace, their home or while they are out with family and friends.
• The length of the studies can vary depending on the research that is being conducted. They can range from a couple of hours of observation, to studies that last several months.

When to use Ethnography?
Ethnography is most useful in the early stages of a user-centered design project. This is because ethnography focuses on developing an understanding of the design problem. Therefore, it makes more sense to conduct ethnographic studies at the beginning of a project in order to support future design decisions (which will happen later in the user-centered design process).
Ethnographic methods (such as participant observation) could also be used to evaluate an existing design – but their true value comes from developing an early understanding of the relevant domain, audience(s), processes, goals and context(s) of use.


Ethnographic research

Organizational Ethnography

Ethnography is a study of culture, therefore, organizational ethnography looks at the culture of organizations.
Organizational culture exists within the minds of the people who make up that organization, while organizational ethnography is concerned with settings within which social relations take place between actors who are set on particular goals.
This culture evolves over time, contains dominant cultures and subcultures, and is subject to its own rules, rites, myths and symbols.
Corporate ethnography isn’t just for innovation anymore. It’s central to gaining a full understanding of your customers and the business itself. The ethnographic work at my company, Intel, and other firms now informs functions such as strategy and long-range planning.

Research Parameters
Ethnographic research are qualitative, inductive, exploratory and longitudinal. They achieve a thick, rich description over a relatively small area.
As the researcher, it is best if you conduct your data gathering on an iterative basis, with you taking on a “reflexive” role – in other words observing, reflecting, building up a theory and then going back into the field and testing it.
This process of testing is essential, because of the inevitable element of subjectivity in a research method where you, the researcher, is the instrument.
There are a number of practical considerations with ethnographic methods, such as:
• Time: Studies are time-consuming to complete.
• Place: You need to make sure that you can get the cooperation of the organization you wish to observe and decide whether you want to look at the whole organization, one part of it or a cross-section.

Data collection methods and triangulation
Most ethnographic research makes considerable use of participant observation, usually triangulated with interviews and/or ordinary “informal” conversations.
Triangulation is particularly important as one method on its own is not usually reliable.
You can also gain a lot of information from other sources, such as:
• Written documents, e.g. e-mails, policy documents, meeting minutes, organisation charts, reports, procedural manuals, “official” corporate material such as an intranet, brochures, press releases, advertising, web pages, annual report.
• Corporate events like the annual staff conference and Christmas party, etc.
• Branding – logo and how it is applied, slogan, etc. Branding is a particularly strong use of symbolism.
• Site location, built environment, design, etc.
Another method used is that of the diary, which participants are required to complete (you will also be completing a diary as part of your participant observation.
This may either have set categories as in structured observation, or the participant may be required to keep a record of their experiences (for example, their reactions to a training course) or of what they do.

What is participant observation?
Participant observation is one of the main Ethnographic research data collection methods.
The essence of participant observation is that you, as the researcher, observe the subject of research, either by participating directly in the action, as a member of the study population, or as a “pure” observer, in which case you do not participate in the action but are still present on the scene, for example observing workers in a manufacturing plant or discussants in the board room.

Structured observation
Structured observation differs from participant observation in that it is more detached, more systematic, and what is observed often has a more mechanical quality. It is also a quantitative as opposed to a qualitative technique, concerned with quantifying behavior as opposed to obtaining a rich description.
Ace research is specialized in conducting all types of market researches and it is in core of our service provision that, quality and robustness is always kept intact, with highest priority. With the pool of specialized field resources across Pakistan, we promise information oriented and substantive research outcomes.
Our Experts, design and implement best research model in light of the latest research practices, in field globally.

Zahid Hussain No Comments

Exploring Log-Frame And it’s Crucial Role in M&E

In practice, a Logical Framework:

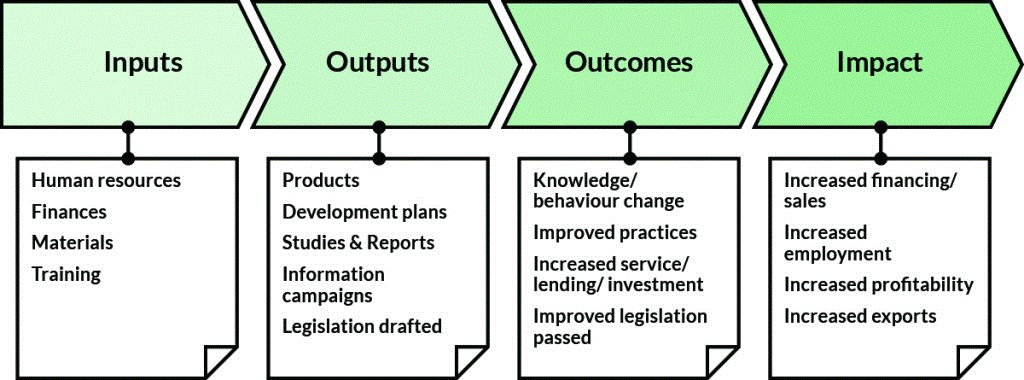
  • Gives a detailed description of the program showing how the program activities will lead to the immediate outputs, and how these will lead to the outcomes and goal (the terminology used varies by organization).
  • Could be used to complete the sentence “we plan to do X which will give Y result”.
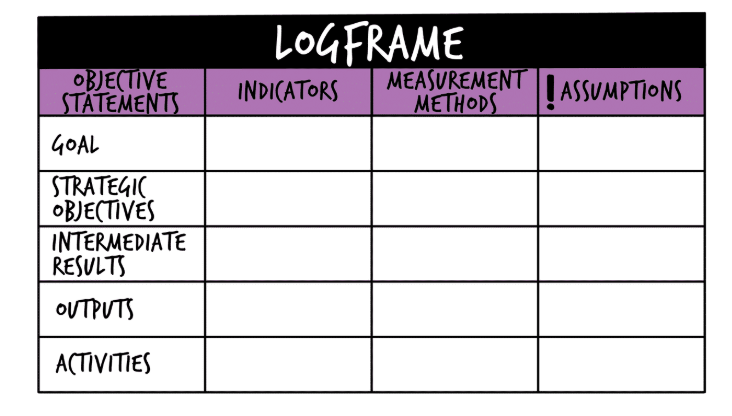
  • Is normally shown as a matrix, called a log-frame. It can also be shown as a flow chart, which is sometimes called a logic model.
  • Is linear, which means that all activities lead to outputs which lead to outcomes and the goal – there are no cyclical processes or feedback loops.
  • Includes space for risks and assumptions, although these are usually only basic. Doesn’t include evidence for why you think one thing will lead to another.
  • Is mainly used as a tool for monitoring.

How to write a logical framework (Log-frame)

Love them or hate them, logical frameworks (Log-frames) have become a staple of international development programs. Most donors will require one as part of your proposal, and it’s the first things an evaluator will ask for.

There is no agreed standard for log-frames. Some organizations call the goal an outcome, while others call it an objective or an impact.

The purpose of a log-frame

A log-frame is a table that lists your program activities, short term outputs, medium term outcomes, and long term goal. It is supposed to show the logic of how the activities will lead to the outputs, which in turn lead to the outcomes, and ultimately the goal.

Should I start with the goal or the activities?

Many people wonder whether they should start filling the log-frame from the top (starting with the goal), or from the bottom (starting with the activities).

Some people would say to start from the top (goal) and work down. That way you state what you hope to achieve, and then you work backwards to decide which outcomes, outputs and activities are required to achieve it.

However, this is often difficult to do in practice. Many organizations have a fixed set of activities that requires them to go from the bottom up. Other organizations may go back and forth between the goal and the activities trying to balance costs against results.

So just fill the table in whichever order makes the most sense to you. For each row of the table (activities, outputs, outcomes and goal) you will need to complete the following steps.

log-frame

Describe the project summary

The first column in the table is the project summary. It describes each level of your project. For example, the goal of the project could be a “10% increase in the number of Grades 5-6 primary students continuing on to high school within 3 years.” The outcome leading to this could be “improve reading proficiency among children in Grades 5-6 by 20% within 3 years.”

When completing the project summary it is very important that the links between the different levels of the project are realistic and logical. Activities should logically lead to outputs, which should lead to realistic outcomes, and a sensible goal.

Choose indicators and means of verification

Once you’ve described each level of the project you need to choose indicators that will allow you to measure if it has been achieved. For example, if the goal is a “10% increase in the number of Grades 5-6 primary students continuing on to high school within 3 years” then the indicator is “percentage of Grades 5-6 primary students continuing on to high school.”

You can have more than one indicator for each level, but it’s a good idea to keep the total number of indicators manageable. For each indicator you need to describe how it will be measured – this is called the means of verification.

The indicators in your log-frame should match the indicators in your M&E framework.

Identify risks and assumptions

The final column in a log-frame is the risks and assumptions. This column lists things that must be true in order for one level to lead to the next level.

An easy way to check whether your risks/assumptions make sense is to look at the activities row and follow this logic: IF these activities are undertaken AND the assumptions are true THEN these outputs will be produced.

Then do the same with the outputs: IF the outputs are created AND the assumptions are true THEN the outcome will be achieved. And then the same for the outcome: IF the outcome is achieved AND the assumptions are true THEN the goal will be achieved.

Zahid Hussain No Comments

Understanding ‘The Monitoring and Evaluation Plan’

A monitoring and evaluation (M&E) plan is a document that helps to track and assess the results of the interventions throughout the life of a program. It is a living document that should be referred to and updated on a regular basis. While the specifics of each program’s M&E plan will look different, they should all follow the same basic structure and include the same key elements.

An M&E plan will include some documents that may have been created during the program planning process, and some that will need to be created new. For example, elements such as the logic model/logical framework, theory of change, and monitoring indicators may have already been developed with input from key stakeholders and/or the program donor. The M&E plan takes those documents and develops a further plan for their implementation.


Why develop a Monitoring and Evaluation Plan?

It is important to develop an M&E plan before beginning any monitoring activities so that there is a clear plan for what questions about the program need to be answered. It will help program staff decide how they are going to collect data to track indicators, how monitoring data will be analyzed, and how the results of data collection will be disseminated both to the donor and internally among staff members for program improvement. Remember, M&E data alone is not useful until someone puts it to use! An M&E plan will help make sure data is being used efficiently to make programs as effective as possible and to be able to report on results at the end of the program.


Who should develop a Monitoring and Evaluation Plan?

An M&E plan should be developed by the research team or staff with research experience, with inputs from program staff involved in designing and implementing the program.


When should a Monitoring and Evaluation Plan be developed?

Monitoring and Evaluation plan should be developed at the beginning of the program when the interventions are being designed. This will ensure there is a system in place to monitor the program and evaluate success.

Who is this guide for?

This guide is designed primarily for program managers or personnel who are not trained researchers themselves but who need to understand the rationale and process of conducting research. This guide can help managers to support the need for research and ensure that research staff have adequate resources to conduct the research that is needed to be certain that the program is evidence based and that results can be tracked over time and measured at the end of the program.

Steps

Step 1: Identify Program Goals and Objectives

The first step to creating an M&E plan is to identify the program goals and objectives. If the program already has a logic model or theory of change, then the program goals are most likely already defined. However, if not, the M&E plan is a great place to start. Identify the program goals and objectives.

Defining program goals starts with answering three questions:

  1. What problem is the program trying to solve?
  2. What steps are being taken to solve that problem?
  3. How will program staff know when the program has been successful in solving the problem?

​Answering these questions will help identify what the program is expected to do, and how staff will know whether or not it worked.

Example: If the program is starting educational skill uplift for girls, the answers might look like this:

Problem High rates of unskilled Girls
Solution Skill enhancement of girls in respective community centers
Success Lowered rates of unskilled Girls in locality

From these answers, it can be seen that the overall program goal is to reduce the rates of unskilled and unaware girls in the community.

It is also necessary to develop intermediate outputs and objectives for the program to help track successful steps on the way to the overall program goal.

Step 2: Define Indicators

Once the program’s goals and objectives are defined, it is time to define indicators for tracking progress towards achieving those goals. Program indicators should be a mix of those that measure process, or what is being done in the program, and those that measure outcomes.

Process indicators track the progress of the program. They help to answer the question, “Are activities being implemented as planned?” Some examples of process indicators are:

  • Number of training held with Girls
  • Number of outreach activities conducted at girls-friendly locations
  • Number of courses taught at girls-friendly locations
  • Percent of girls reached with program awareness messages through the media or WOM

Outcome indicators track how successful program activities have been at achieving program objectives. They help to answer the question, “Have program activities made a difference?” Some examples of outcome indicators are:

  • Percent of girls turning up for course in first round
  • Number and percent of trained peer leaders from that from local community  providing services to girls
  • Number and percent of new girls enrolling in course and also, those turning up for jobs with latest skills acquired

These are just a few examples of indicators that can be created to track a program’s success.

Evaluating the performance over time:

Usually a Quasi-experimental design of pre and post comparison of the same group is applied i.e. the treatment group. The individual score will determine the status of girls’ like in our example; score on a specific time i.e. the score at pre time or post time. The difference between the two will determine the progress of girls from the pre to the post situation. This difference will be calculated through single difference and will be considered as impact of the program.

Step 3: Define Data Collection Methods and Timeline

After creating monitoring indicators, it is time to decide on methods for gathering data and how often various data will be recorded to track indicators. This should be a conversation between program staff, stakeholders, and donors. These methods will have important implications for what data collection methods will be used and how the results will be reported.

The source of monitoring data depends largely on what each indicator is trying to measure. The program will likely need multiple data sources to answer all of the programming questions. Below is a table that represents some examples of what data can be collected and how.

Information to be collected Data source(s)
Implementation process and progress Program-specific M&E tools
Service statistics Facility logs, referral cards
Reach and success of the program intervention within audience subgroups or communities Small surveys with primary audience(s), such as provider interviews or client exit interviews
The reach of media interventions involved in the program Media ratings data, broadcaster logs, Google analytics, omnibus surveys
Reach and success of the program intervention at the population level Nationally-representative surveys, Omnibus surveys, community data
Qualitative data about the outcomes of the intervention Focus groups, in-depth interviews, listener/viewer group discussions, individual media diaries, case studies

Once it is determined how data will be collected, it is also necessary to decide how often it will be collected. This will be affected by donor requirements, available resources, and the timeline of the intervention. Some data will be continuously gathered by the program (such as the number of training), but these will be recorded every six months or once a year, depending on the M&E plan.

After all of these questions have been answered, a table like the one below can be made to include in the M&E plan. This table can be printed out and all staff working on the program can refer to it so that everyone knows what data is needed and when.

Indicator Data source(s) Timing
Number of training held with Community Girls Training attendance sheets Every 6 months
Number of outreach activities conducted at Girls-friendly locations Activity sheet Every 6 months
Number of course taught at youth-friendly locations Subject Sheet / teachers manual Every 6 months
Percent of girls receiving program messages through the media or WOM Population-based surveys Annually
Percent of prospective girls willing to take skill enhancement program population-based survey Annually
Number and percent of peer leaders providing trainings to Girls Facility logs Every 6 months
Number and percent of new enrollments population-based survey Annually

Step 4: Identify M&E Roles and Responsibilities

The next element of the M&E plan is a section on roles and responsibilities. It is important to decide from the early planning stages who is responsible for collecting the data for each indicator. This will probably be a mix of M&E staff, research staff, and program staff. Everyone will need to work together to get data collected accurately and in a timely fashion.

Data management roles should be decided with input from all team members so everyone is on the same page and knows which indicators they are assigned. This way when it is time for reporting there are no surprises.

An easy way to put this into the Monitoring and Evaluation plan is to expand the indicators table with additional columns for who is responsible for each indicator, as shown below.

Indicator Data source(s) Timing Data manager
Number of training held with Community Girls Training attendance sheets Every 6 months Activity manager
Number of outreach activities conducted at Girls-friendly locations Activity sheet Every 6 months Activity manager
Number of course taught at youth-friendly locations Course sheet Every 6 months Activity manager
Percent of girls receiving program messages through the media or WOM Population-based survey Annually Research assistant
Percent of prospective girls willing to take skill enhancement program population-based survey Annually Research assistant
Number and percent of peer leaders providing training to Girls Facility logs Every 6 months Field M&E officer
Number and percent of new enrollments population-based survey Annually Research assistant

Step 5: Create an Analysis Plan and Reporting Templates

Once all of the data have been collected, someone will need to compile and analyze it to fill in a results table for internal review and external reporting. This is likely to be an in-house M&E manager or research assistant for the program.

The Monitoring and Evaluation plan should include a section with details about what data will be analyzed and how the results will be presented. Do research staff need to perform any statistical tests to get the needed answers? If so, what tests are they and what data will be used in them? What software program will be used to analyze data and make reporting tables? Excel? SPSS? These are important considerations.

Another good thing to include in the plan is a blank table for indicator reporting. These tables should outline the indicators, data, and time period of reporting. They can also include things like the indicator target, and how far the program has progressed towards that target.

Step 6: Plan for Dissemination and Donor Reporting

The last element of the M&E plan describes how and to whom data will be disseminated. Data for data’s sake should not be the ultimate goal of M&E efforts.  Data should always be collected for particular purposes.

Consider the following:

  • How will M&E data be used to inform staff and stakeholders about the success and progress of the program?
  • How will it be used to help staff make modifications and course corrections, as necessary?
  • How will the data be used to move the field forward and make program practices more effective?

The Monitoring and Evaluation plan should include plans for internal dissemination among the program team, as well as wider dissemination among stakeholders and donors. For example, a program team may want to review data on a monthly basis to make programmatic decisions and develop future work plans, while meetings with the donor to review data and program progress might occur quarterly or annually. Dissemination of printed or digital materials might occur at more frequent intervals. These options should be discussed with stakeholders and your team to determine reasonable expectations for data review and to develop plans for dissemination early in the program. If these plans are in place from the beginning and become routine for the project, meetings and other kinds of periodic review have a much better chance of being productive ones that everyone looks forward to.

Zahid Hussain 1 Comment

Buy Now Pay Later – An Opportunity Unexplored

Buy Now Pay Later (BNPL) has quickly risen to prominence in the UK in the last decade, with Swedish challenger bank Klarna, which arrived in the UK in 2014, spearheading this exciting new form of credit. BNPL provider’s partner with retailers to give consumers the option of upfront credit which can be paid at a later date, either via a deferred payment in full or by splitting the payment across multiple fixed installments with any interest agreed upfront and built into the repayment plan. The rise in BNPL services has predominantly come around thanks to a series of fintechs coming to the table as payment platforms and partnering with leading e-commerce retailers to offer interest free credit at checkout. According to a 2020 Worldpay report, BNPL fintechs are growing at a rate of 39 percent annually in the UK, with expectation that they will double their ecommerce market share by 2023.

BNPL

Slow to the digital field in general; Pakistan’s e-commerce marketplace has hit a major growth spurt in 2020 and 2021, with revenue growing by over 35 percent in the first quarter of the fiscal year 2021 alone. It is also a younger demographic: 40 percent of the population is under the age of 30. Also, the increased access to digitization – even rural areas have 3G at this point – has served to give commerce a massive shove forward.

Where does BNPL fit in the wider consumer credit industry?

BNPL is a ‘during purchase’ payment option which is predominantly present in ecommerce, although there have been products launched for face-to-face point of sale (PoS) transactions, such as Klarna In-store (by QR code), Klarna Card and Laybuy. Other consumer credit options include PoS finance, and revolving credit cards. PoS finance is typically initiated in-store when purchasing electronics and household goods, and such solutions have historically had socioeconomic status around them. The revolving credit card is perhaps most under threat from BNPL, although our Capco research shows that credit cards are here to stay for the time being.

However, what Pakistan is lacking, QisstPay Co-founder Jordan Olivas told Karen Webster in a recent conversation, is an easy way to access credit. Credit card penetration is low, and cash remains king when it comes to making payments. The market clearly needs another option, which is what Pakistani version of BNPL aims to offer as it introduces buy now, pay later (BNPL) as a tool to the Pakistani market.

“The problem in Pakistan today is that there aren’t a lot of ways to get formal credit,” noted Olivas. “So this is something very specific. We are not offering lines of credit. We’re not issuing loans. What we are doing is factoring invoices, in a sense. We’re essentially buying the invoice from the merchant and extending a partial net 30 to the consumer.”

As a result, the consumer gets a chance to split up their payments – paying 50 percent at the time of purchase and the other half 30 days later. That payment cycle was chosen to match up with typical Pakistani pay cycles, which are usually 30 days.

Like QisstPay, a conventional buy now pay later (BNPL) credit facility initiative; KalPay is a Shariah Compliant Buy now Pay later service. It allows customers to use credit and payback in installments or delay their payments.

WHAT IS THE CUSTOMER NEED?

The growth of digital wallets and mobile commerce will be at the forefront of future BNPL adoption, given the younger demographic focus and personalized user experience already available on BNPL apps. During the 2019 holiday season in Australia, Afterpay reportedly saw 80 percent of all their customer base using their mobile phones to BNPL, proving that convenience is still king, this can be validated through a Market Research.

Market research should never be underestimated. Many successful new businesses enjoy longevity because their owners conduct regular market research to understand their target market, identify consumer problems and pinpoint realistic competitors. In Pakistan, companies undermine the long term benefits of market research. Least weightage is assigned to market research when deciding relevant markets for products and services. Companies do have provision for market research but are reluctant to invest in getting a real-time market assessment and as a result, often their strategies and policies are ineffective in capturing a true market share of forecasted targets. This leads to inconsistency in growth, earning and customer retention in the longer run.

Market Research is the simplest way for entrepreneurs to keep up with market trends such as, BNPL and maintain a competitive edge by sizing up your business opportunity.

Market research can be carried out at various stages of a business life cycle, from pre-launch and beyond. Having a greater understanding of your marketplace from the very start will enable you to create a sound business strategy to establish and grow your brand into one that’s better than the competition.

Ace Research is one of the leading market research and customer experience management companies in Pakistan with a team dedicated to helping the client get the insights that they desire. Our years of experience speak of our keen analysis of customer preference and nevertheless, approach to identify and materialize market opportunity. Our team has an eye upon all the latest market trends and at the moment it is BNPL.

Market Research ‘Assessing BNPL need from the customer’s perspective’

  • It helps new startup BNPL businesses strengthen their position
  • It minimizes any investment risk involved in exploring new opportunities.
  • It identifies potential threats and opportunities for BNPL companies
  • It helps to discover yours and your competitor’s strengths and weaknesses, n this context other local and regional competitors
  • It facilitates strategic planning
  • It assists businesses to stay ahead of the competition
  • It provides revenue projections
  • It focuses on customer needs and demands, the foremost important need for new BNPL startups
  • Identifies Target Audience ‘Core Essential for Business Growth’
  • It helps to evaluate the success of business against benchmarks

An International survey found that companies that benchmark achieve 69% faster growth and 45% greater productivity than those that don’t. Use market research to analyze competitors, employee engagement surveys and to highlight performance or knowledge gaps and areas for potential growth. This will open your company up to thinking about new methods, ideas, and tools to improve your business effectiveness.

WHO IS BNPL FOR?

Buy Now Pay Later has been stereotyped as a solution for people who live paycheck to paycheck, however, a series of consumer research carried out by multiple different sources has identified that it is in fact simply a great solution for the budget conscious and more ‘credit averse’ consumers. Indeed, our consumer research survey on BNPL found that almost 30 percent of BNPL users were well above the average UK individual annual income.

Furthermore, our consumer research indicated that consumers like the concept of BNPL as it gives them the flexibility to manage their finances, regardless of income level. For the majority of those who have used BNPL before, they even prefer it to other forms of credit, like credit cards or store cards20. At present, BNPL purchases are clustered around typically cheaper retail items but there is a clear appetite to pay for more expensive items using BNPL too.

TRUST & LOYALTY

To date, how a consumer selects a BNPL option has been driven by the merchants they shop with. Strong partnerships with a broad range of merchants enable Klarna, ClearPay, LayBuy and PayPal Credit to shape the UK’s BNPL and consumer credit markets. The branding of these BNPLs are also very much present on social media channels, and even Transport for London advertising spaces, such as on the tube and on sides of London buses. This begs the question; does the same amount of thought go into selecting a BNPL provider as you would with choosing a new bank? Loyalty plays a big role in consumer behaviors, but whether the BNPL era is driving loyalty amongst consumer’s remains to be seen. After that first purchase with a BNPL provider, does the consumer become more attached and loyal to that brand, or would they ‘cheat on them’ for their next BNPL transaction? We don’t know the answer to this exactly, but we do know that one of the biggest issues online retailers face is the dreaded shopping basket paralysis.

A CHANGING ATTITUDE TOWARDS CREDIT

The presence of BNPL providers is playing a key role in changing the buying behaviors and general outlook on traditional methods of credit. Our research shows, contrary to the youthful marketing image of BNPL, the biggest users of BNPL are in fact 35 – 44-year-olds (Gen Y and X demographics), followed by the over 65s (Boomers) according to our research26, which suggests more mature demographics are not averse to trying new types of credit; and as aforementioned, BNPL is the most preferable form of credit for those who have used it to make a payment before.

By providing a manageable way for consumers to borrow and repay with the interest (where applicable) built into the repayment plan with fixed-end date, BNPL providers are giving consumers more assurance that they can repay without falling into a revolving credit repayment.

IMPLICATIONS FOR BANKS AND CREDIT CARD ISSUERS

The rise of BNPL services demonstrates the need for banks and credit card issuers to act quickly in response to this demand for change. Unsecured credit is transforming, and credit card issuers need to consider new ways of offering credit to consumers; furthermore, with the cost of credit reportedly rising27, customers may be driven towards alternative lending solutions sooner rather than later. Banks have been considered a trusted source of lending, so it seems like a no-brainer to give customers the choice to pay by instalments. This would additionally give customers a tool within their existing safe and trusted banking space to manage their finances, avoiding taking on additional apps and new lenders. Almost half of our surveyed BNPL users would like this service (45 percent) from their bank or credit card provider28. We believe banks should be making a defensive ‘play’ in this space to maintain their existing market share by:

  1. Looking at investing in installments solutions
  2. Creating their own standalone BNPL products
  3. Partnering with a BNPL provider to provide either of the above.

Big Untapped Opportunity Lies Ahead

Banks with existing merchant relationships may have a competitive edge in entering the BNPL space. If they’re already partnering with merchants with credit card or other private-label credit card or other financial products, they’re really well positioned. This opportunity is wide open to all banks in Pakistan.

While there is much to be said for being the first player out on a greenfield – as QisstPay is in Pakistan – there is the massive challenge of getting both consumers and merchants on board and willing to use something new. While services like Afterpay might see their most avid users tapping into the service five or six times a month, a QisstPay superuser might use the platform once or twice.

But company management believes, they will see that change over time, particularly as they are able to recruit more merchants onto the platform, and as the new payment form becomes more familiar to customers. This has been the pattern as BNPL platforms have emerged elsewhere in the world.


Zahid Hussain No Comments

How to Counter Fraud in Market Research?

Fraud and misrepresentation of reports is the common norm, which erodes elements of transparency in research activity. If proper checks are not set in place, such loopholes can be catastrophic in decision making phase because it relies upon data gathered during the research process.

In Pakistan, research ethics and professionalism is the salt sold very cheap. No standards are in place to guide and curb such sheer violation of research basics. Data is infringed with biased, wrong and irrelevant responses. Least efforts are made to ensure data verifiability and authenticity. According to an estimate, 25-30% fraud rate is obvious in all the research activities.

By reviewing data conformity to objectives on each level can mitigate unwanted practices but this idea is not practical where scope is too high.

Some of the common survey frauds

  • Same surveys are performed multiple times by one respondent – Duplicate respondent error

Unique IP address and link to email accounts can minimize this error also, using one single platform to submit responses will help us in getting unique submissions. Also, at times it can be accidental, Accidental “fraud” occurs when survey participants are not aware they are taking the same survey multiple times. This happens when online surveys do not block duplicate entries. Another source of accidental errors can occur when a survey respondent is a member of multiple online panels that are all sending respondents the same survey. But in all cases, these respondents are not actually committing fraud. They are simply good people accidentally participating more than one time in the same survey.

On other hand, there is this group committing Intentional fraud, it occurs when a survey participant deliberately tries to complete a survey multiple times, or provides inaccurate answers to survey questions. The motives are either to alter the results of the survey or to reap extra financial incentives. These individuals routinely join and participate in as many online panels as they can. They have their browsers reset browser cookies and history after each survey attempt, make common use of “incognito modes,” and utilize VPN services (commercial and free) to circumvent any geographic restrictions. Online surveys that offer bigger incentives tend to attract more intentional fraud. These are individuals you definitely do not want in your online surveys.

Minimizing Fraud – Protection mechanism

  • Research targets such as, households or retail branches when not visited, or doubted as not visit for this purpose – Geo Tagging is used. The first component of a fraud defense is geo-location. Geo-location can be provided by the device itself (mobile devices, etc.), by a previous data point created by survey participants when signing up, or via their computer’s IP address. Geo-location or tagging results are generally trusted and acceptable at the country level.
  • Another widely used method that is used to track survey participants is a device/browser fingerprint. This “digital” fingerprint is built up from components and properties of the browser, such as fonts installed, plugins registered, screen size, color depth, and many other variables that uniquely identify a computer, tablet, or smartphone.
  • Another strategy is to put questions (i.e., cheater traps) in an online survey with nonsensical answers that might trap a participant who is rushing through a survey.
  • Cookies are also used to track respondents across and within online surveys. Cookies are widely used to prevent duplicate survey entries and are easy to implement.
  • To reach right audience or diffuse chances of fraud, random calls are made to assess the authenticity of online and offline surveys.
  • At the same time, Ace research has devised one of the most comprehensive Quality check process. This ensures optimally the integrity and accuracy of data at all levels. It minimizes human errors by putting in place review mechanism.
  • All the reports and submission if cross checked with underlined instruction shared with shoppers and surveyors – with zero tolerance policy for any deviation also helps in mitigating fraud.

Other ways to minimize fraudulent responses

Two less common and more difficult to interpret components of a fraud defense are survey metadata and open-end verbatim analysis. Survey metadata includes details like how long survey participants took to complete a particular survey or question, how long they spent writing an answer to an open-end question, or how many times they changed their answers. Consequently, determining what constitutes fraud from metadata requires some human legwork and tends to vary survey by survey.

The same is true of the analysis of open-end questions. While sentiment analysis is commonplace now, it is fraught with misclassifications for anything but the simplest of cases. Going a step further and performing more sophisticated analysis of open-ends to identify fraudulent responses is even more difficult. However, there are some simple things that can be done to help check for fraudulent open-ends. Checking for gibberish, repetitive answers, and off-topic responses can help identify fraud.